This post analyzes a simple discrete system I called Circlestones.
Definition 1. Circlestones
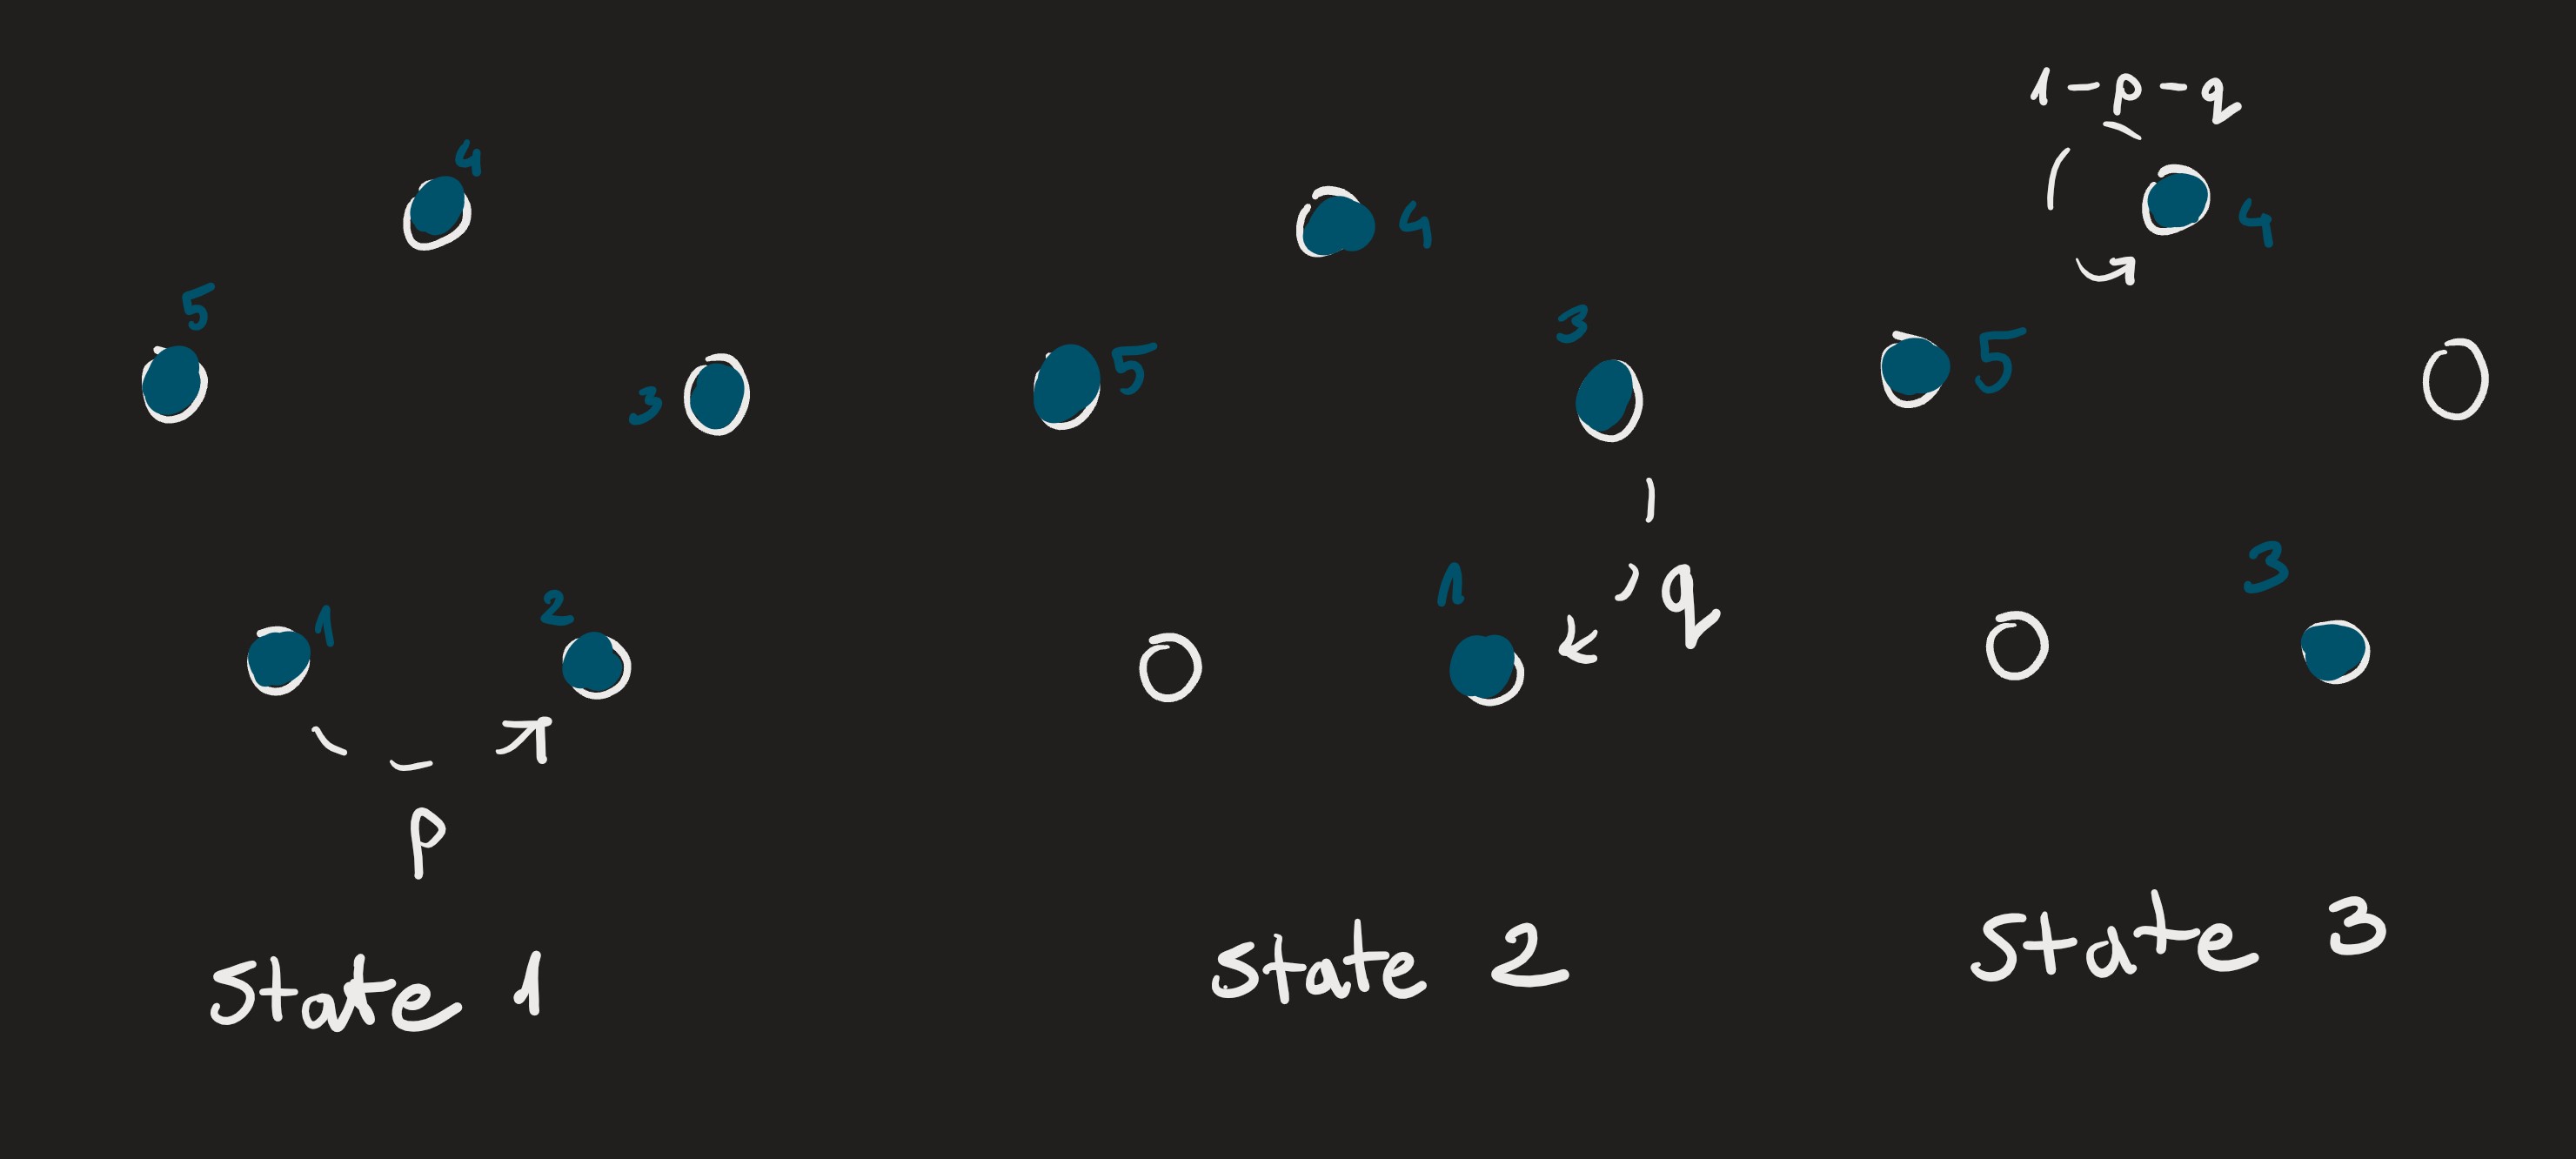
$n$ distinct (numbered) stones are arranged in a circle. For every stone in order (after the $n$-th stone we turn back to the one with the smallest index) we move it right (with probability $p$), left (with probability $q$) or leave it in place (with probability $1-p-q$). If a spot is occupied the current stone takes the place of the stone that has been on the spot earlier.
Example 2.
 Possible course of the game. Stone 1 jumps right with probability $p$ and takes the stone 2. Next smallest stone is the stone 3 - it jumps left with probability $q$ and takes the stone 1. Finally the next smallest stone - stone 4 - stays in place with probability $1-p-q$.
Definition 3.
Stopping time is the amount of steps before there is only one stone left.
There are many questions we can ask about this system, e.g. what is the expected stopping time of a game?
Approximating stopping times
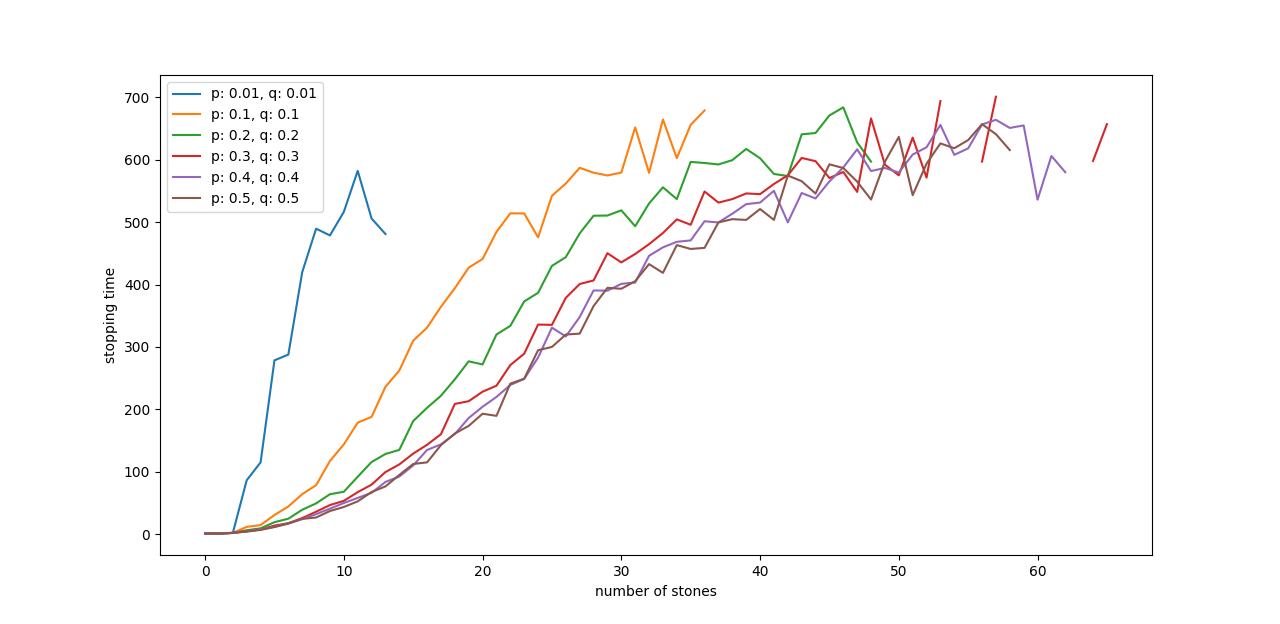
I ran a simulation of a 100 games with different settings, where $p=q$. The x axis stands for the number of stones, while y axis shows after how many steps - on average - the game stopped.
It’s quite natural to see that as probability of stones staying in place increases, the stopping time increases as well.
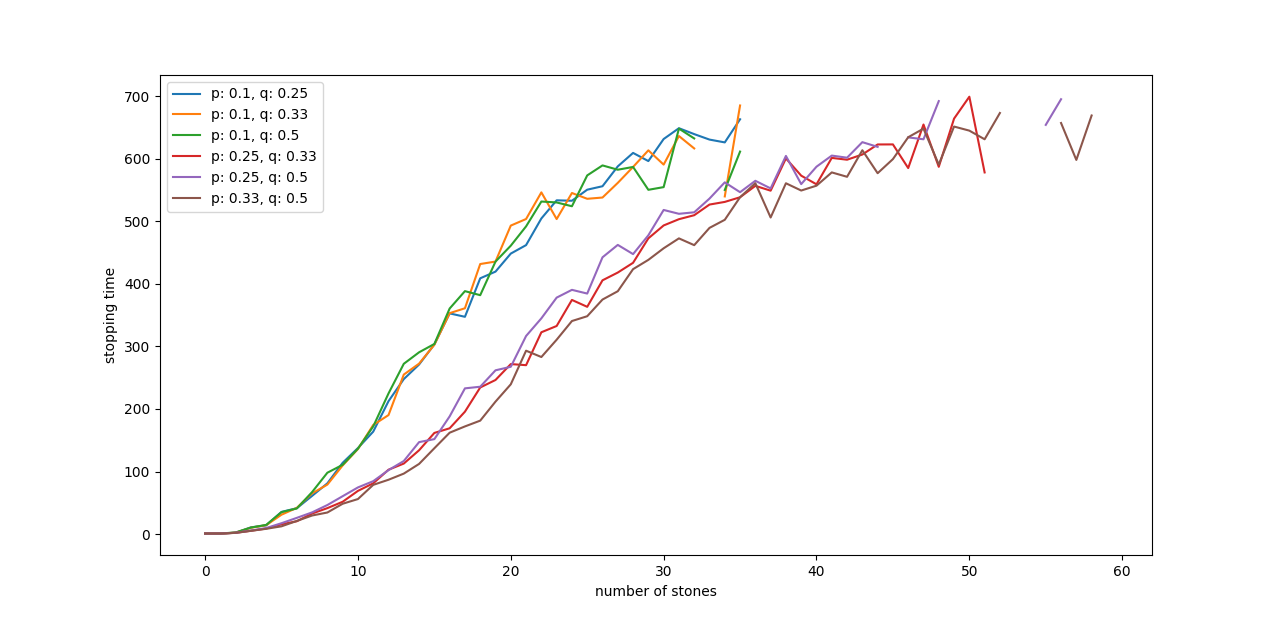
Let’s see what happens when there is a tendency of stones to jump to the right.
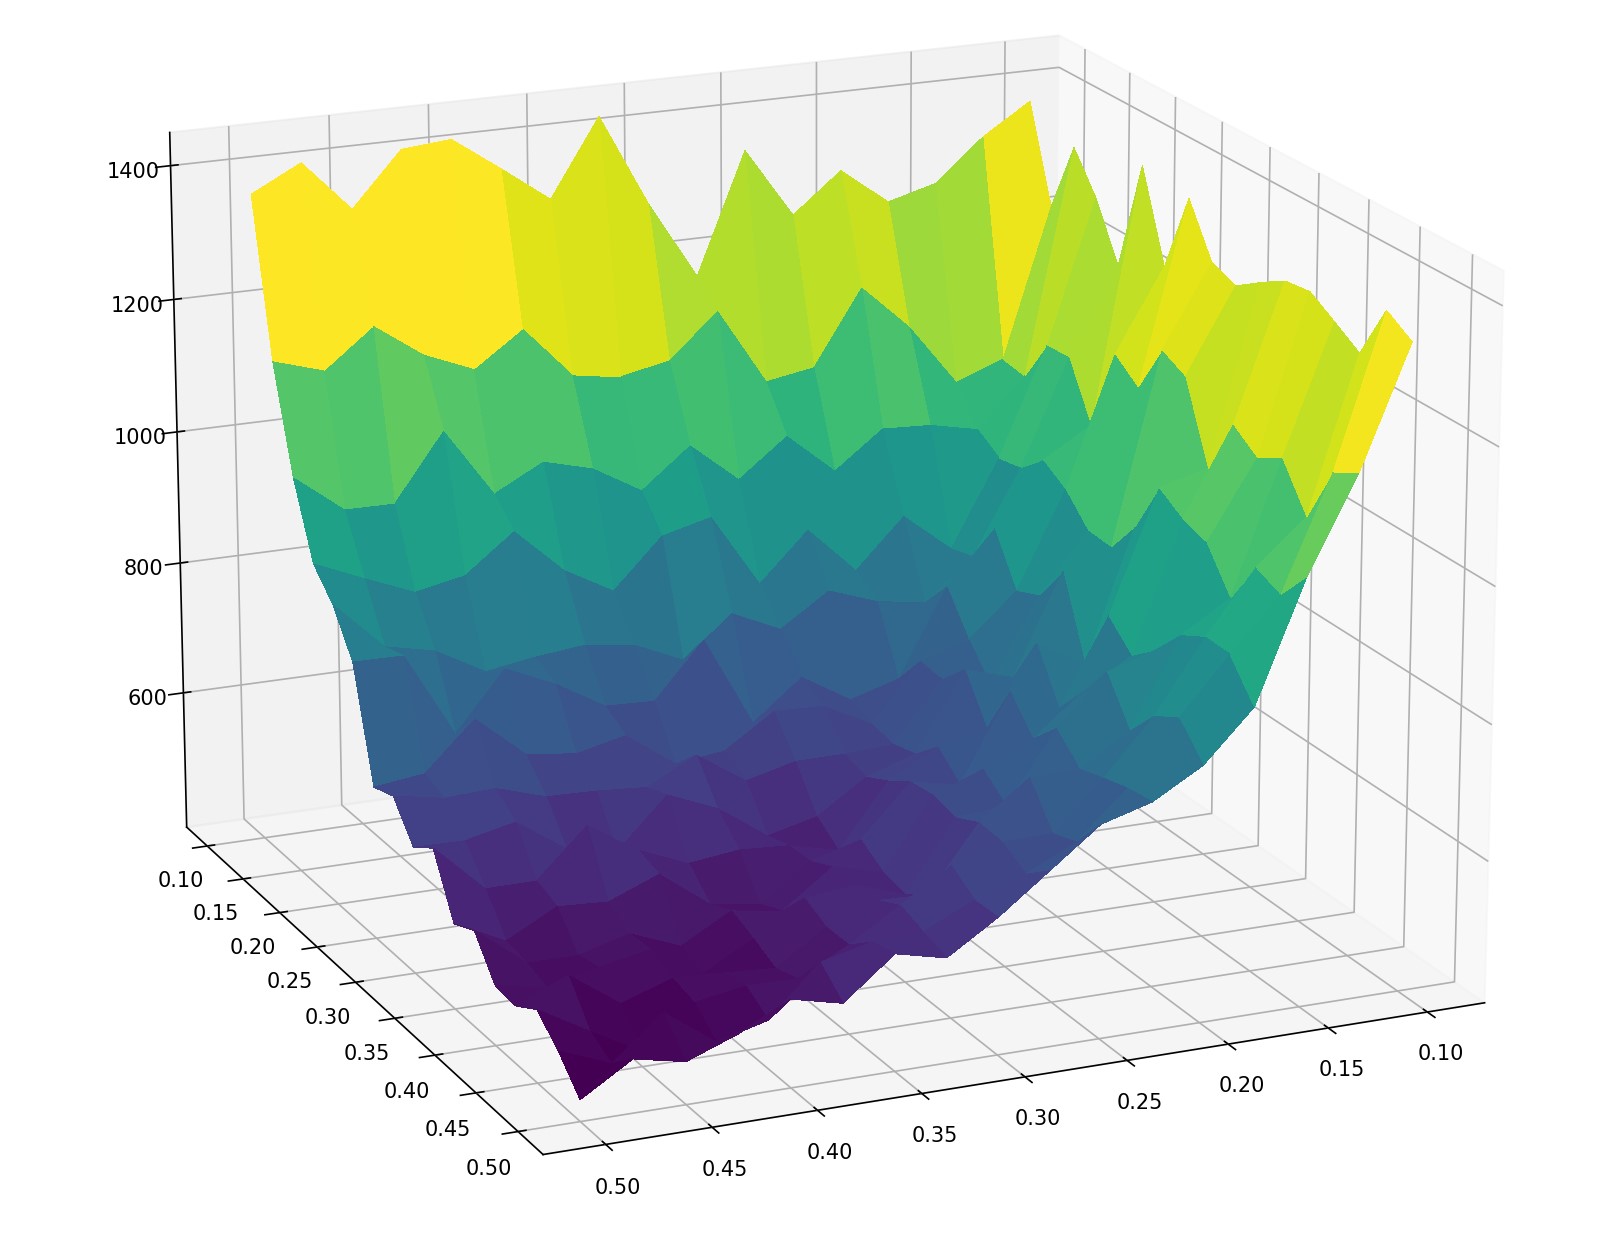
It’s interesting to see these curves overlap, despite different $p, q$ values. To explore the relationship between $p, q$ and the average stopping time, I ran a simulation of a game with $50$ stones. Bottom axis stand for varying $p, q$ values.
Obviously the plot is symmetrical, as the tendency of stones jumping sideways is symmetric. What’s interesting is how non-linearly the average stopping time changes. Whether it is polynomial or exponential - that’s a topic for another post.


